ApexDiagram vs Visio, Lucidchart, draw.io and the discovery tools
· 4 min read
Where the drawing tools and the discovery tools are stronger, where they fall short for network documentation, and what only ApexDiagram does.
Network diagramming tools fall into two camps. Drawing tools give you a canvas and leave the meaning to you. Discovery tools scan the network and show you what is there today. ApexDiagram sits between them: a structured record of the network that you can fill by hand, by import or with an assistant, shown as four synchronised views that follow the OSI model. This post says plainly where each tool is stronger and where it falls short.
The short version
Prices as of September 2026. Check each vendor's pricing page before relying on them.
| Tool | Price (Sept 2026) | What it is | Where it falls short for network documentation |
|---|---|---|---|
| Microsoft Visio | $5 to $15 per user per month, no free tier | General diagramming inside Microsoft 365 | Shapes have no network meaning; data linking needs Plan 2; one view per page, maintained by hand |
| Lucidchart | $9 per user per month; free tier limited to 3 documents | Collaborative diagramming with AI generation | Same picture problem; no linter, BOM, IPAM or compliance output; no network-config import |
| draw.io | Free, open source | Canvas with good stencils, Confluence and Jira integration | No record behind the drawing; nothing to lint or export beyond the image |
| Eraser | $15 to $20 per member per month | Diagram-as-code with AI editing | Built for software architecture, not cabling, VLANs or racks |
| Scanopy | $80 per month flat; free community edition | Agentless scan with four views and self-hosting | Shows what exists; cannot draw a planned network or a Purdue zoning |
| Auvik, Domotz, Network Glue | From $35 per site per month to quote-only | Continuous discovery and monitoring | Collector on the network, per-device or per-site pricing, no design |
| SolarWinds NTM | $1,495 perpetual, end of life Sept 2026 | Discovery-based mapping | Discontinued; its Visio exports import into ApexDiagram |
| ApexDiagram | See plans and pricing | One record, four views, linter, BOM, imports, API | No live polling; discovery data arrives as files or API pulls that you approve |
Versus the drawing tools
Visio, Lucidchart and draw.io are good at drawing. If you need an org chart or a floor plan, use them. The gap shows the first time you need the diagram to answer a question.
- Does anything share an IP? They cannot know. ApexDiagram's linter reports it, with a jump to the device.
- What do we order for the second site? You read the drawing and type a list. ApexDiagram's BOM groups devices by make and model, sums cable lengths, and exports CSV, Excel or PDF.
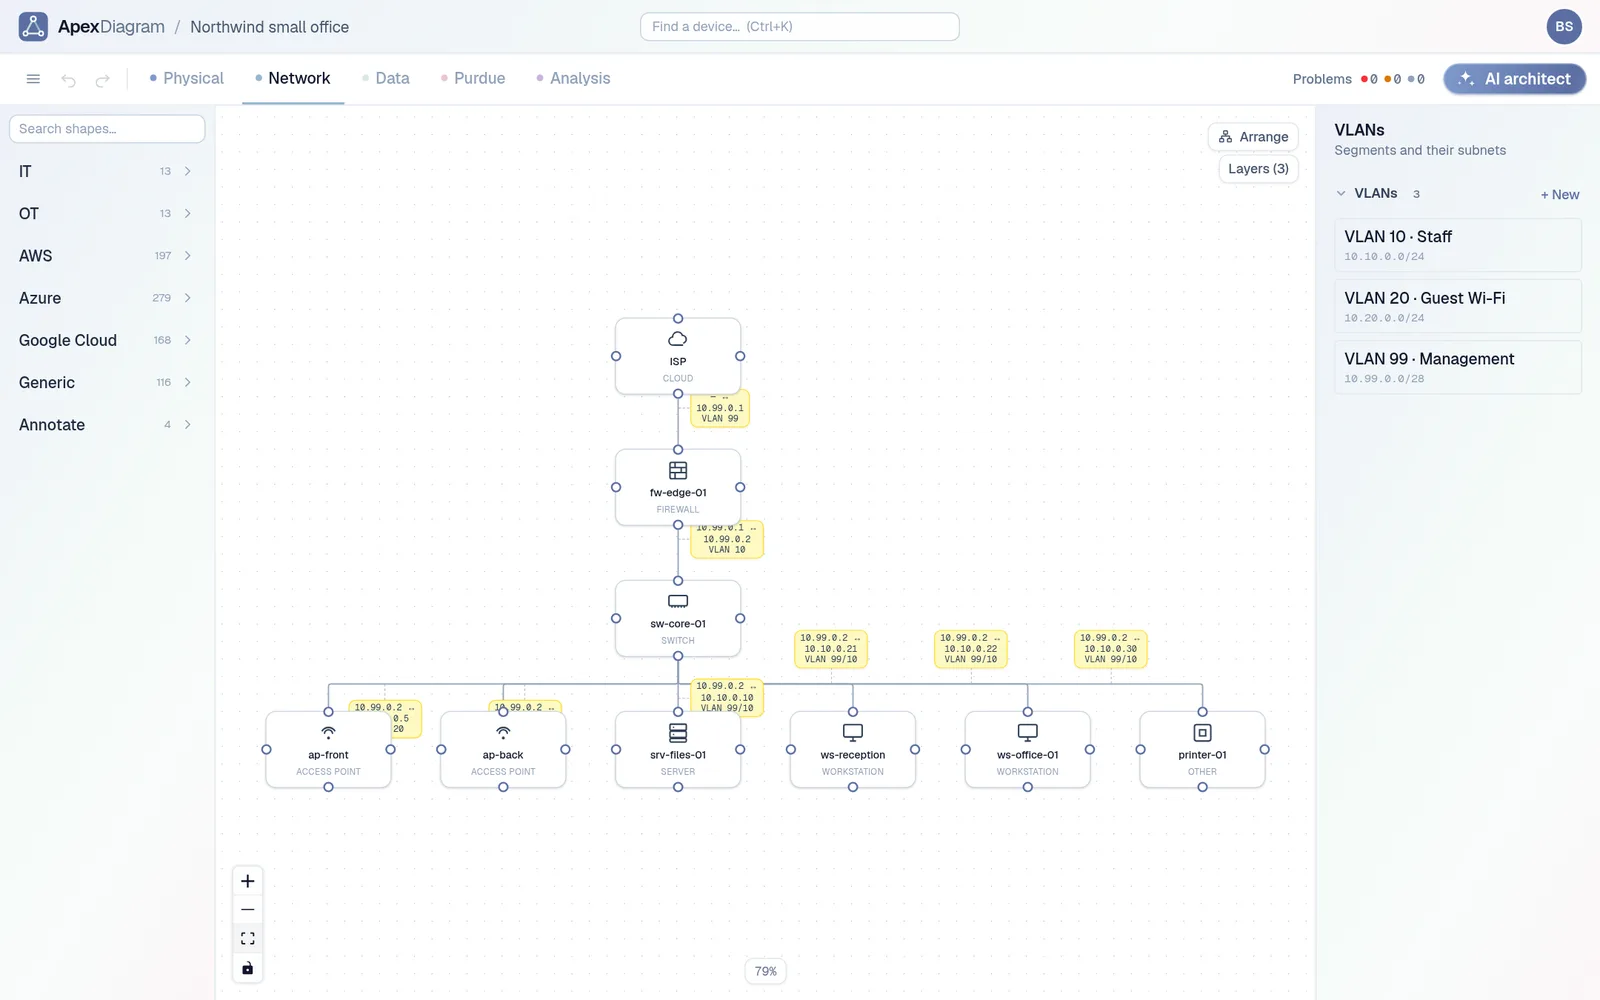
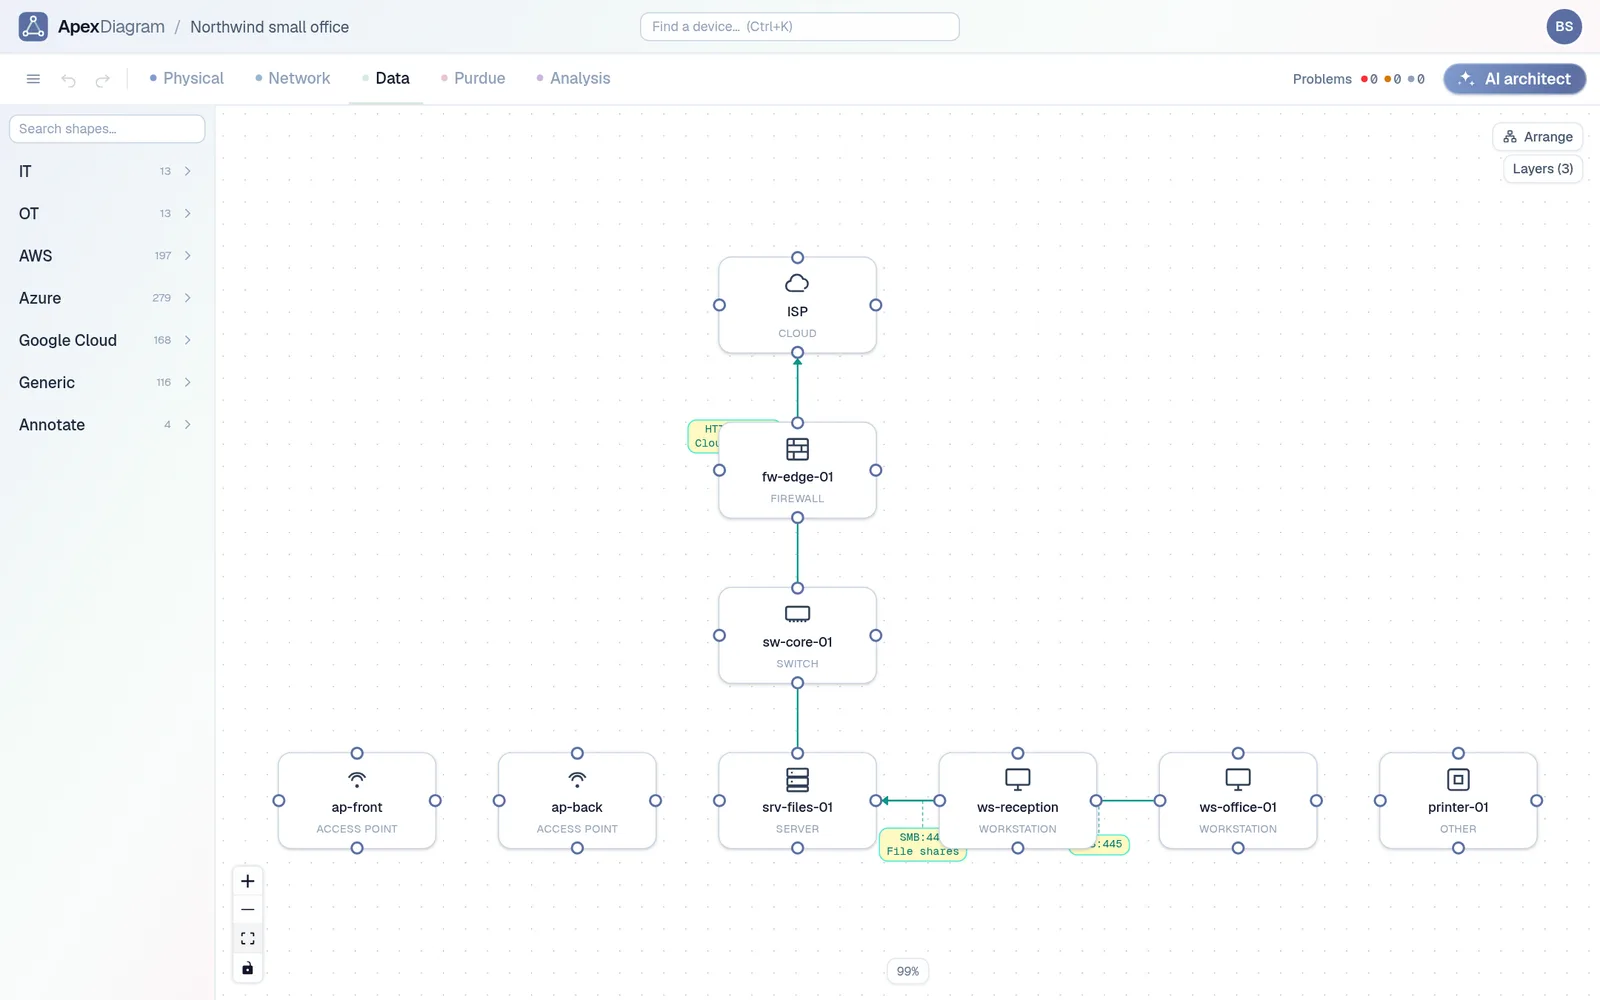
- The core switch was replaced. You update the physical page, the logical page, the data-flow page and the rack drawing. In ApexDiagram you edit one record and all four views change.
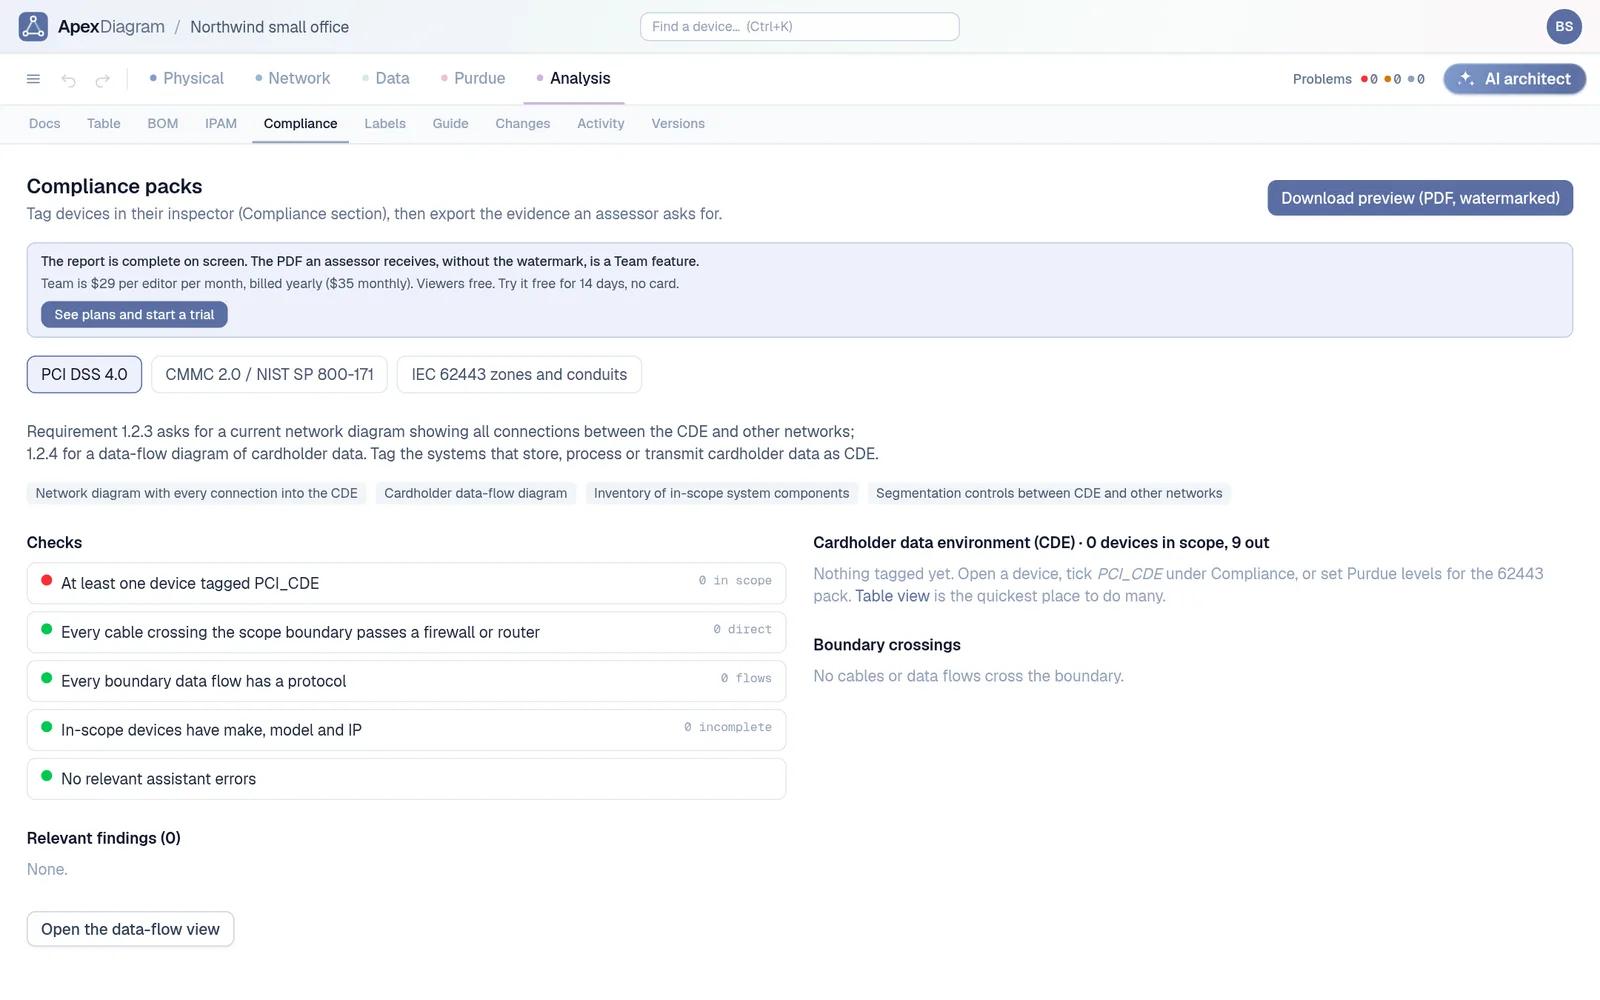
- What crosses the PCI boundary? You trace lines with a finger. ApexDiagram lists every cable and flow across the boundary and flags the ones with no firewall at either end.
Two things the drawing tools do better: Lucidchart's real-time multi-cursor collaboration, which ApexDiagram replaces with autosave, versions and change requests rather than live cursors, and the sheer breadth of general-purpose stencils. You can upload your own SVG symbols, and you can import your existing draw.io and Visio files, so nothing you already drew is lost.
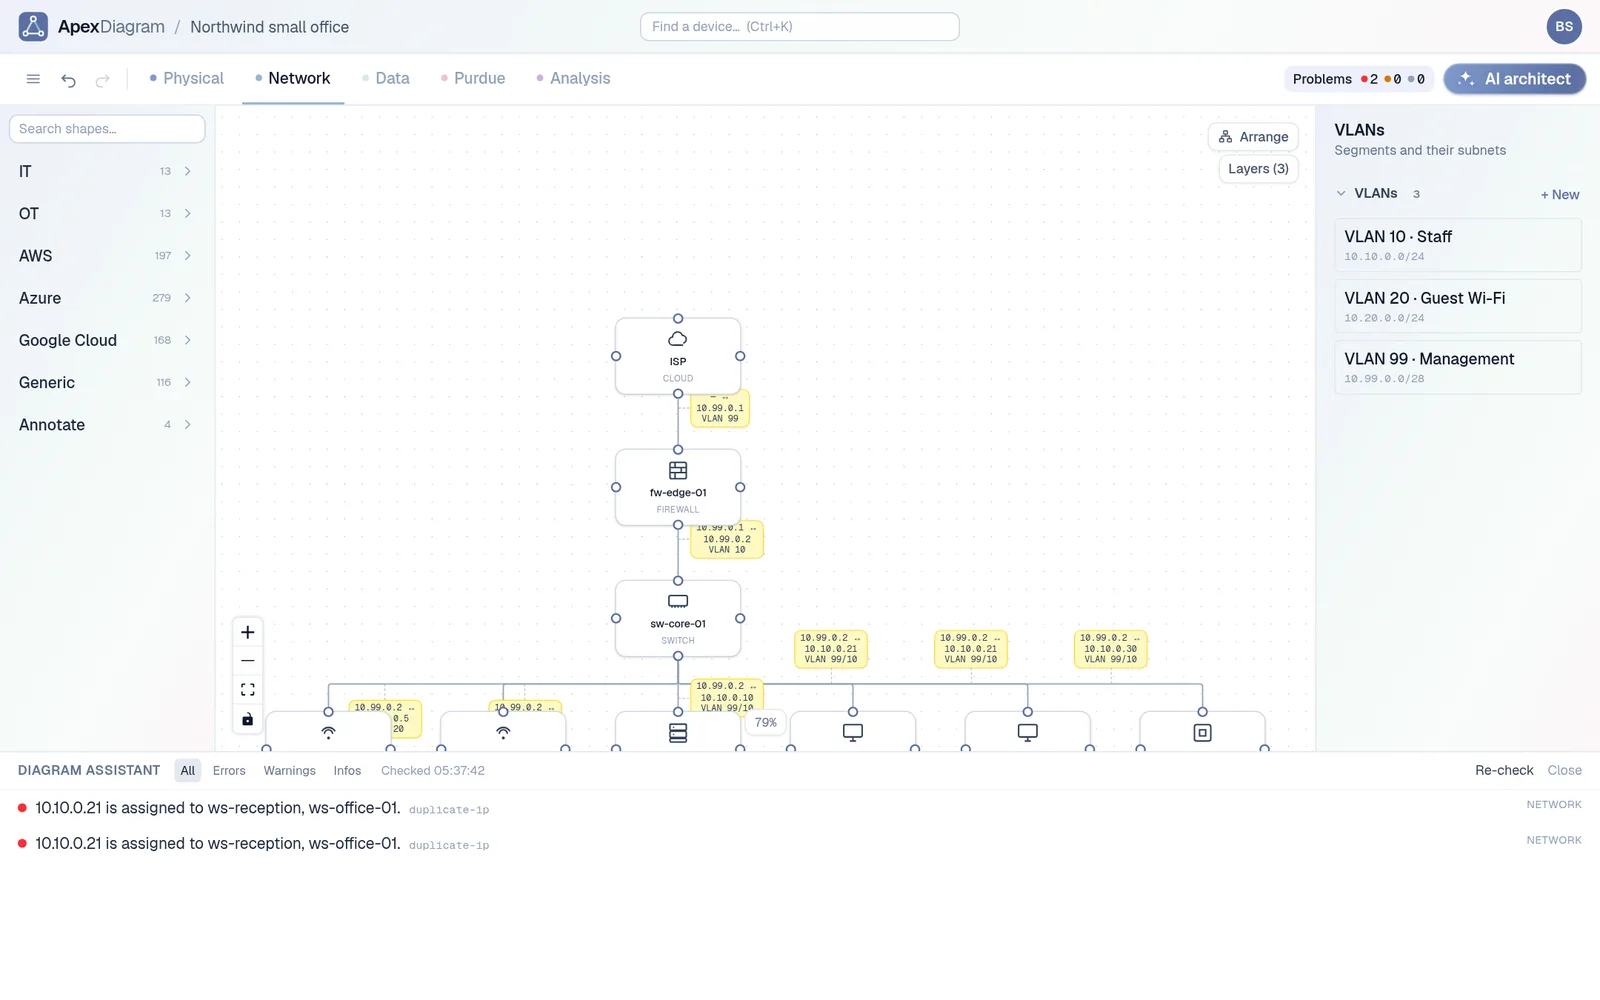 A drawing cannot tell you two devices share an IP; ApexDiagram can
Versus the discovery tools
Auvik, Domotz and their peers answer "what is on the network right now" better than anyone, and they charge for it: a collector to install, a per-device or per-site fee, and a map that only shows what exists. They cannot draw the network you are planning, the VLAN you have not created yet, or the Purdue zoning the auditor wants on paper.
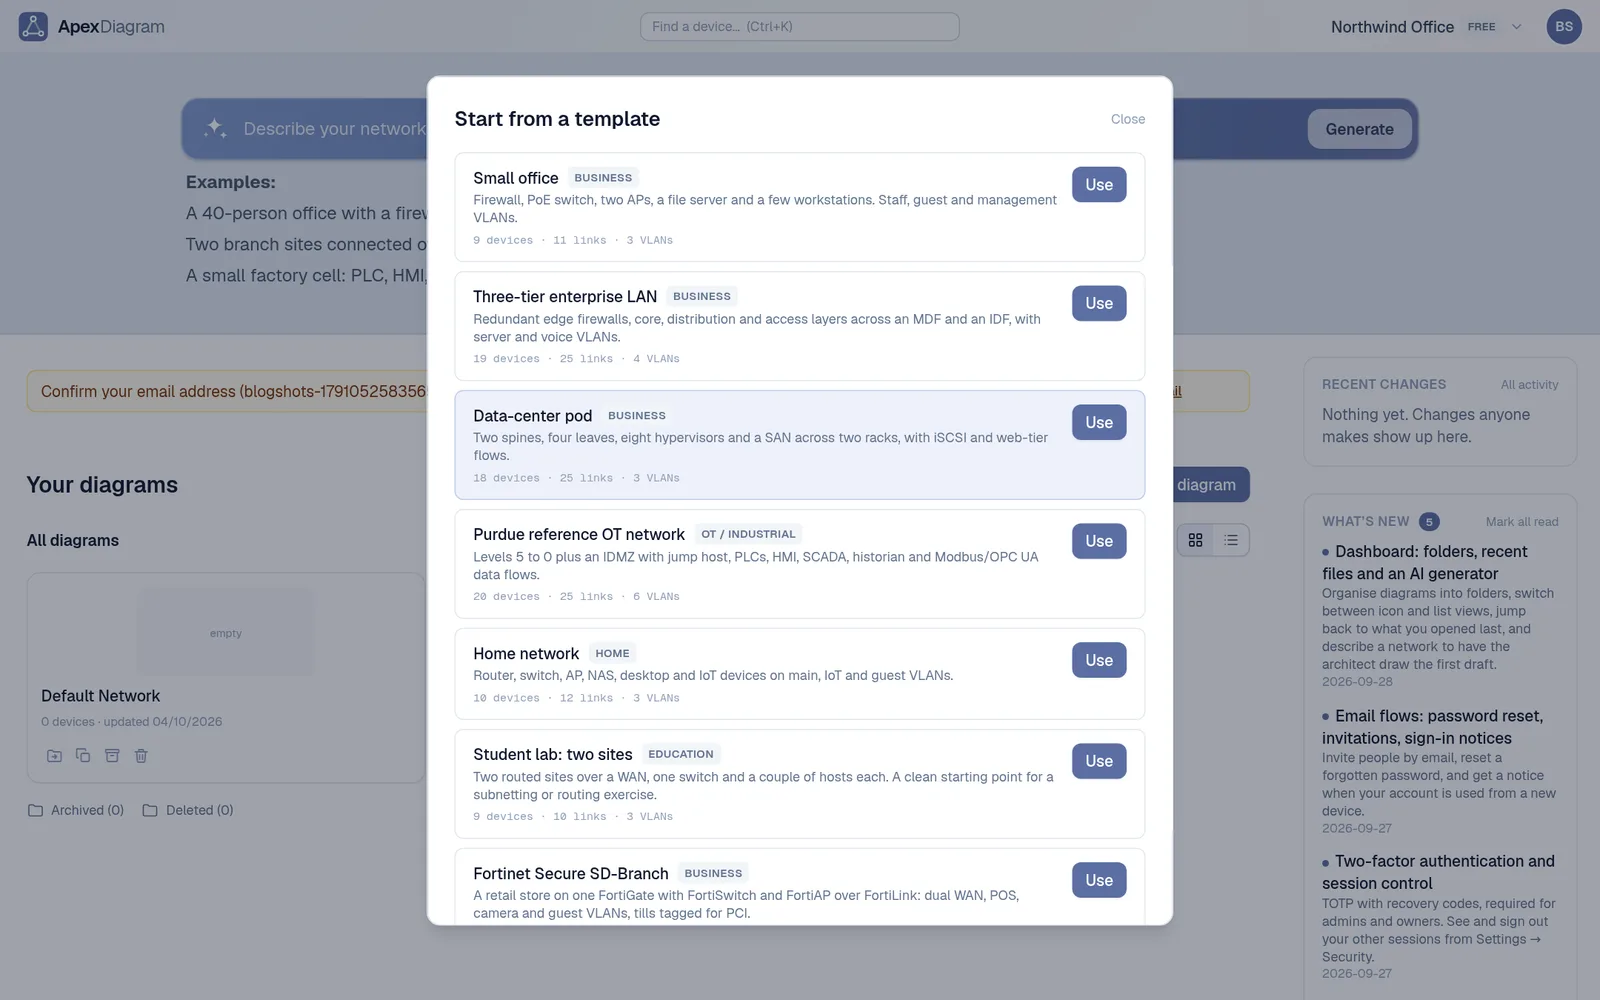
ApexDiagram does not poll. It imports the output of the tools you already have: an nmap scan, an LLDP or CDP neighbour table, a pfSense or OPNsense config, UniFi and Meraki exports, a NetBox pull. Each import shows a diff and saves a version before anything changes. For most companies under 500 seats that is the right trade: current enough, no agent, flat pricing.
What only ApexDiagram does
- Four views of one record, following the OSI model: Physical, Network, Data and Purdue. Nothing is copied between them.
- A linter for the network, not the drawing: seventeen rules from duplicate IPs to rack overflow and zone crossings.
- Compliance packs for PCI DSS 4.0, CMMC and NIST 800-171, and IEC 62443, with a one-click audit PDF.
- IPAM in the diagram: subnet utilisation, next free address, a VLSM planner that creates the VLANs.
- Diagram to lab: export a Containerlab topology and boot the network you drew.
- Diagram as code: YAML export and import that diffs cleanly in git.
- An AI architect that edits the record through the same API you can call, and an MCP server so your own assistant can too.
- Labels with QR codes that open the device record on a phone.
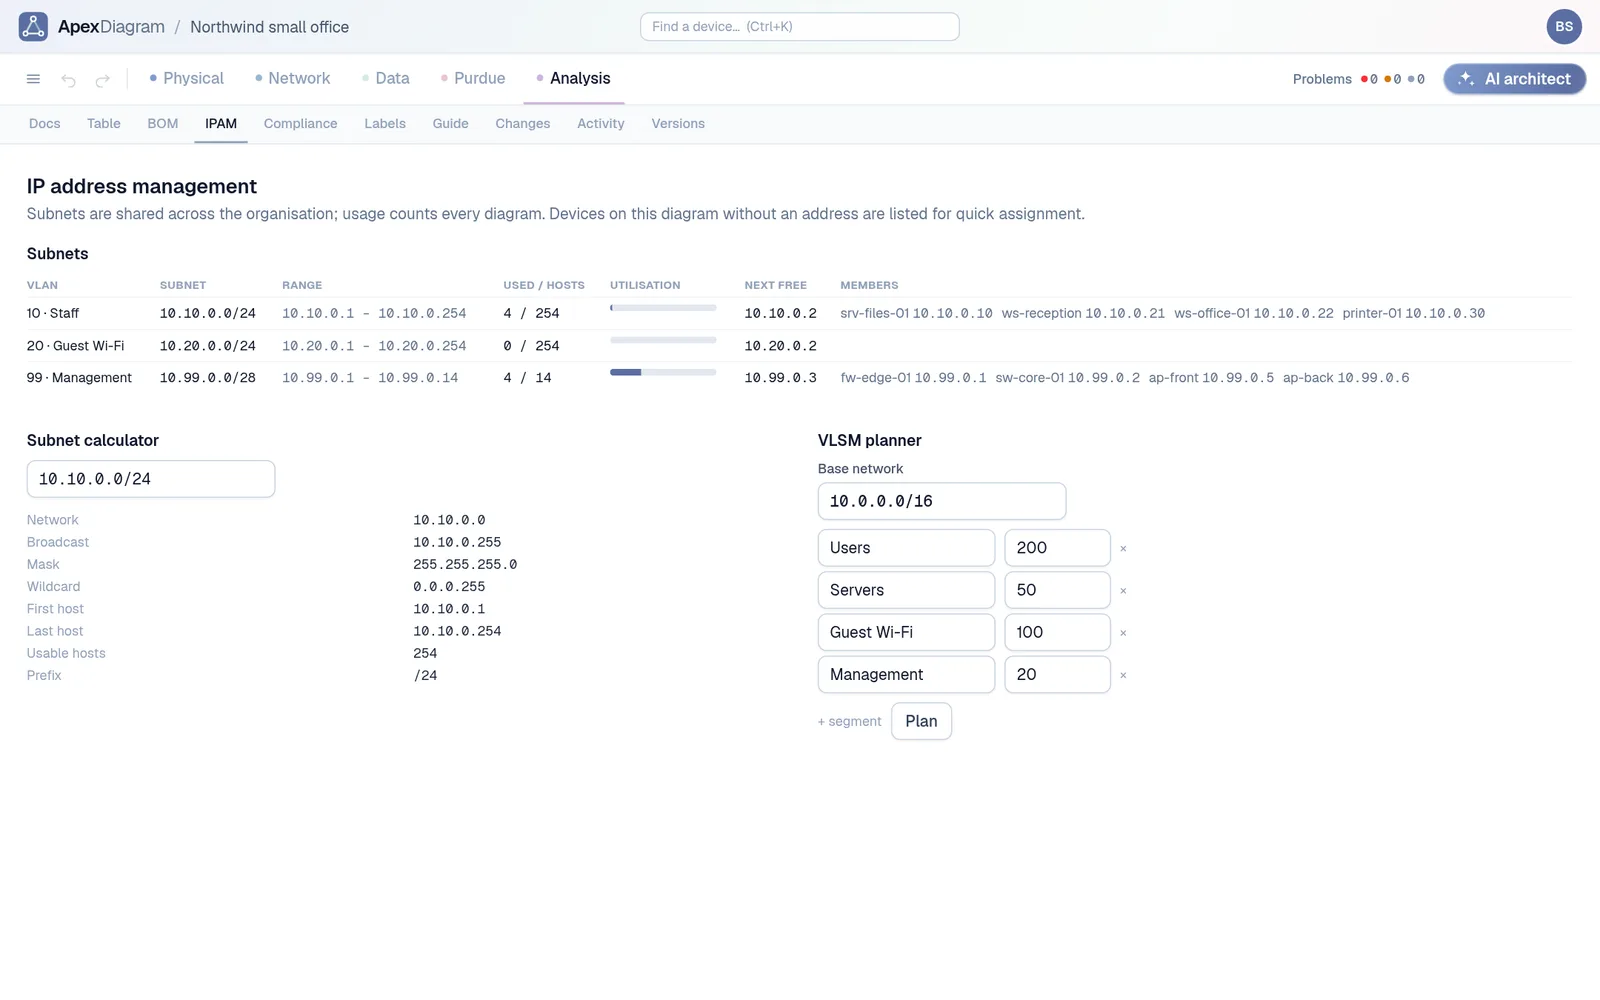 IPAM inside the diagram: subnets, utilisation, next free address
Who should not switch
If your diagrams are mostly not network diagrams, keep Visio or Lucidchart. If you need alerting when a switch goes down, you need a monitoring tool as well, and ApexDiagram will happily import its exports. If you have a 5,000-device estate with a NetBox team, ApexDiagram is the picture on top of NetBox, not a replacement for it.
Try it with the file you already have
Drop your Visio or draw.io file on the dashboard and see what it finds. See plans and pricing.
Document your network once, keep it current
One network graph, four synchronized views, a linter and a bill of materials. Import the Visio or draw.io file you already have.
Join the beta