Visualise NetBox: network diagrams from your source of truth
· 3 min read
NetBox holds the facts but does not draw them. How to turn NetBox devices, cables and prefixes into physical, network and data views that stay in step.
NetBox is where a lot of teams keep the truth about their network: sites, racks, devices, interfaces, cables, prefixes and VLANs. What it does not do well is draw it. The topology plugins help, but people still end up maintaining a Visio file next to NetBox, and the two drift apart.
The better split is to let NetBox stay the source of truth and generate the diagrams from it. This guide shows how with ApexDiagram.
What comes across
| NetBox | ApexDiagram |
|---|---|
| Device role (core, access, firewall, edge, patch panel and so on) | Device type |
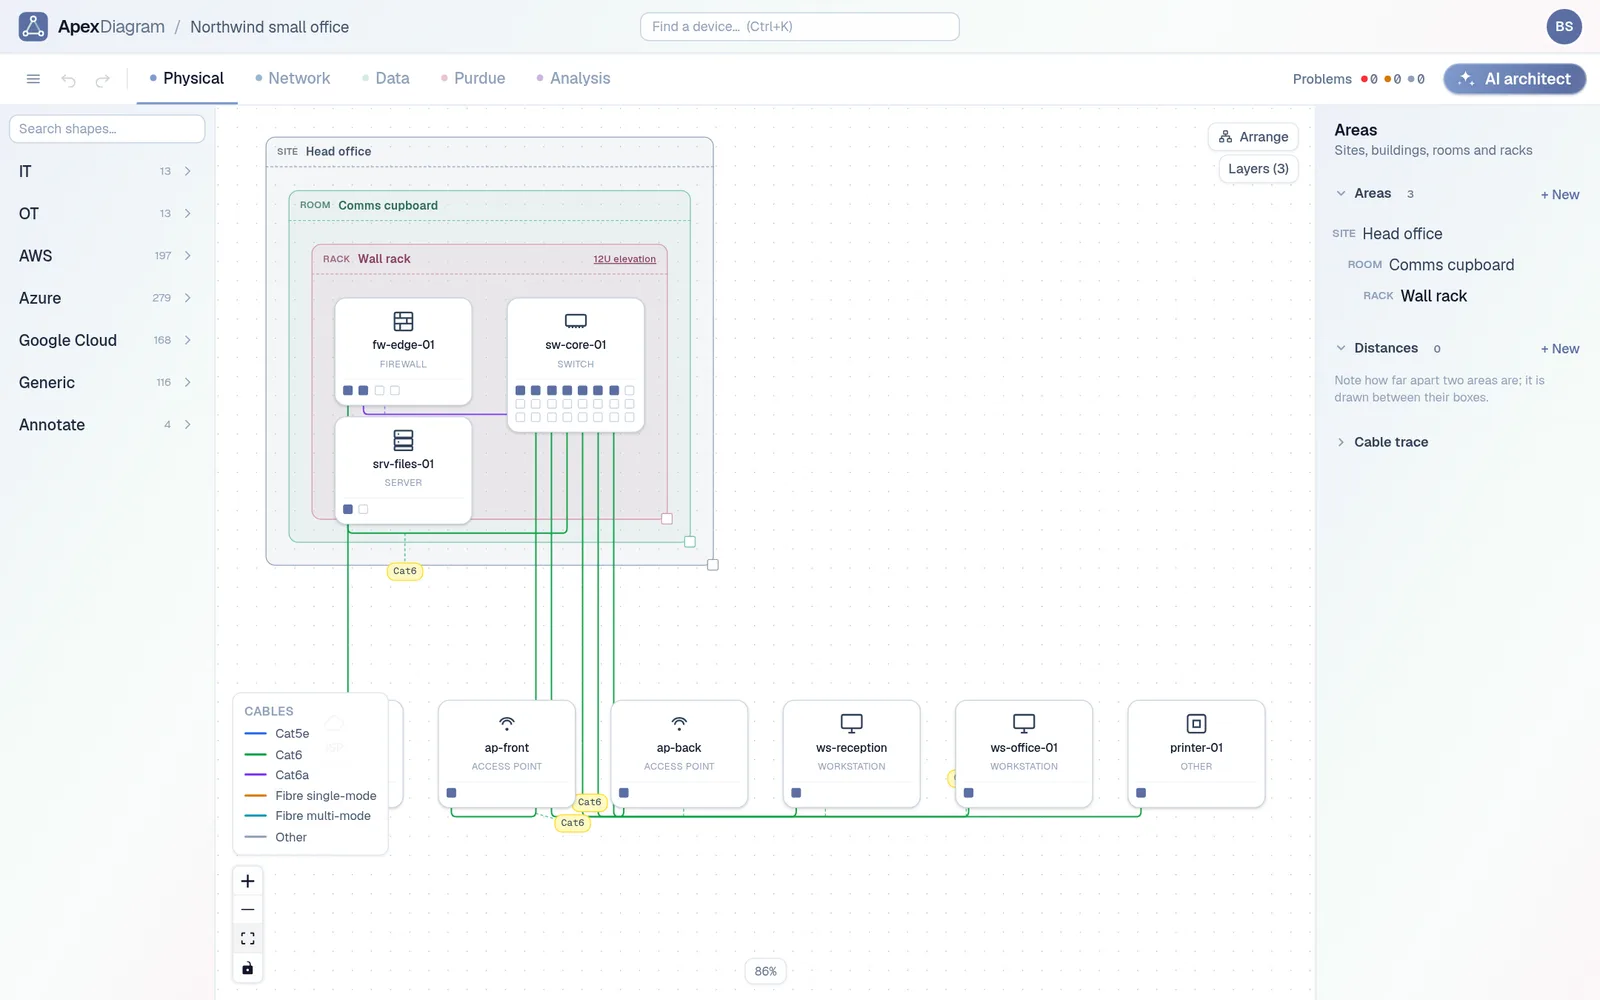
| Site, location, rack and position | Nested locations, with the device in its rack unit |
| Primary IPv4 | The device's address on its first port |
| Prefixes with a VLAN | VLANs and subnets |
| Cables | Links, with the interface names as the port labels |
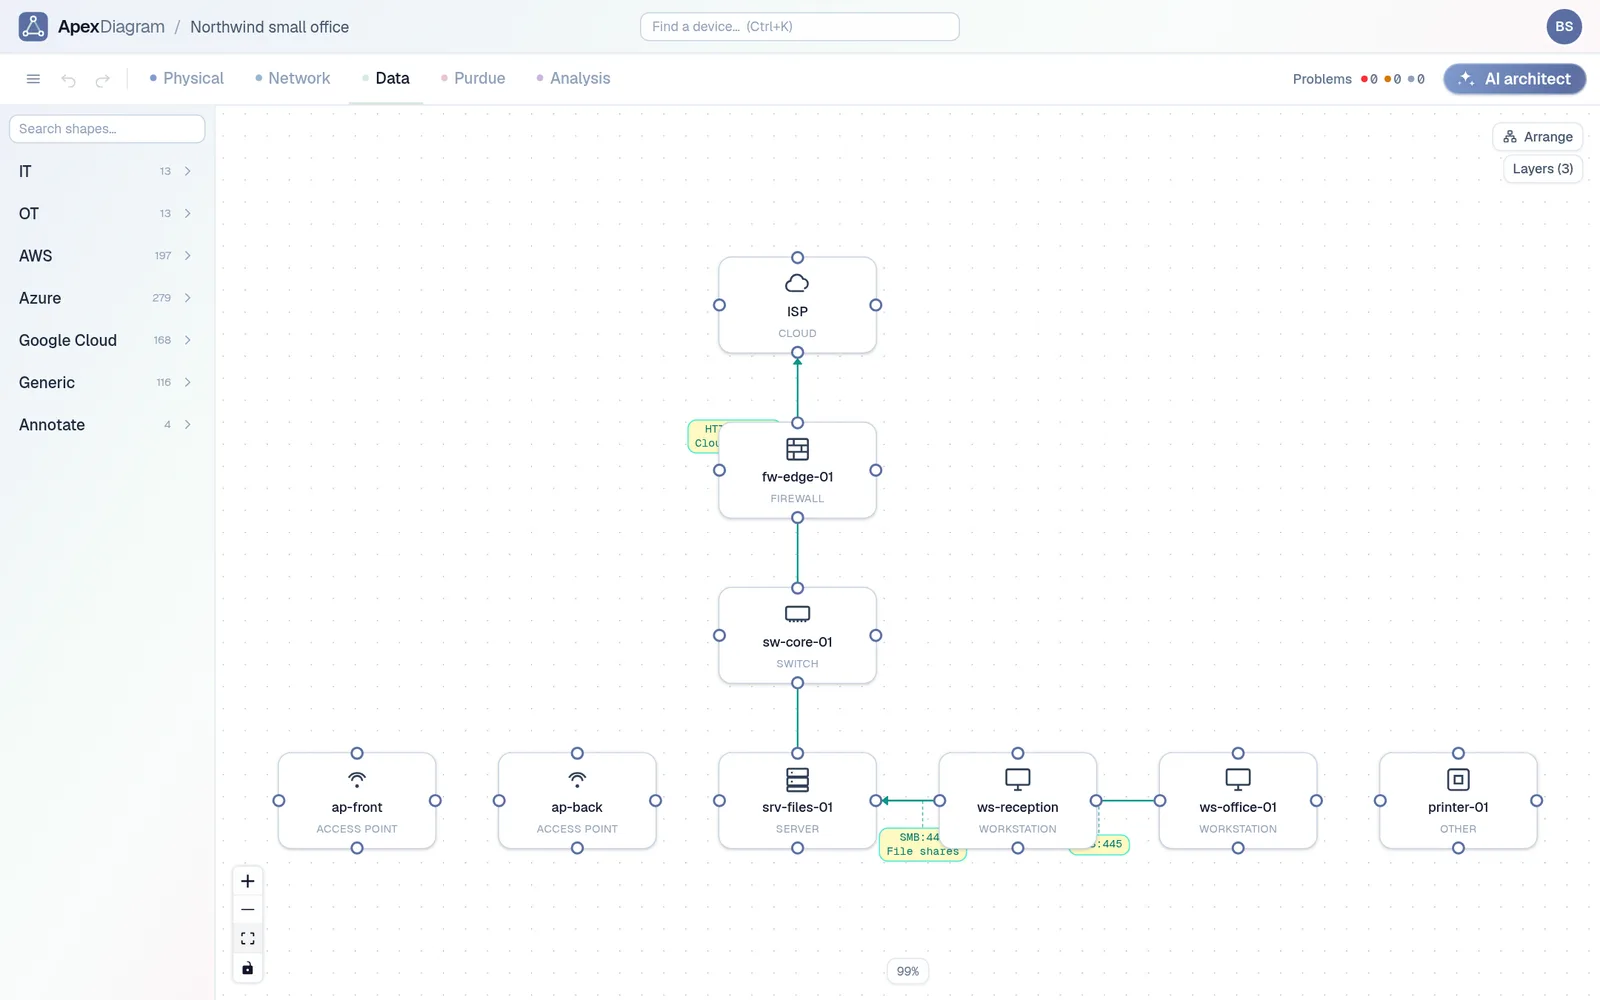
Once imported, the same record draws the Physical view (sites, rooms and racks, cables by type), the Network view (VLANs, subnets and addresses) and the Data view, and the BOM, IPAM and labels come from it too.
Option 1: a JSON export
Pull three lists from the NetBox API and put them in one file:
NB=https://netbox.example.com
TOKEN=your_read_only_token

curl -s -H "Authorization: Token $TOKEN" "$NB/api/dcim/devices/?site=hq&limit=1000" > devices.json
curl -s -H "Authorization: Token $TOKEN" "$NB/api/dcim/cables/?site=hq&limit=1000" > cables.json
curl -s -H "Authorization: Token $TOKEN" "$NB/api/ipam/prefixes/?site=hq&limit=1000" > prefixes.json

jq -n --slurpfile d devices.json --slurpfile c cables.json --slurpfile p prefixes.json \
  '{devices: $d[0].results, cables: $c[0].results, prefixes: $p[0].results}' > netbox.json
Drop netbox.json on the dashboard. A plain device list (the output of the first call on its own) works too, but you lose the cables and subnets.
For more than a thousand of anything, follow the next links or raise the limit your NetBox allows.
Option 2: a live pull
Open the diagram, then Refresh from file → NetBox, and give it the NetBox URL, a token and a site. ApexDiagram fetches devices, cables and prefixes with paging, shows you the diff against the diagram, and applies it when you say so. The token is used for that request and is not stored.
Use a read-only token. ApexDiagram only reads from NetBox.
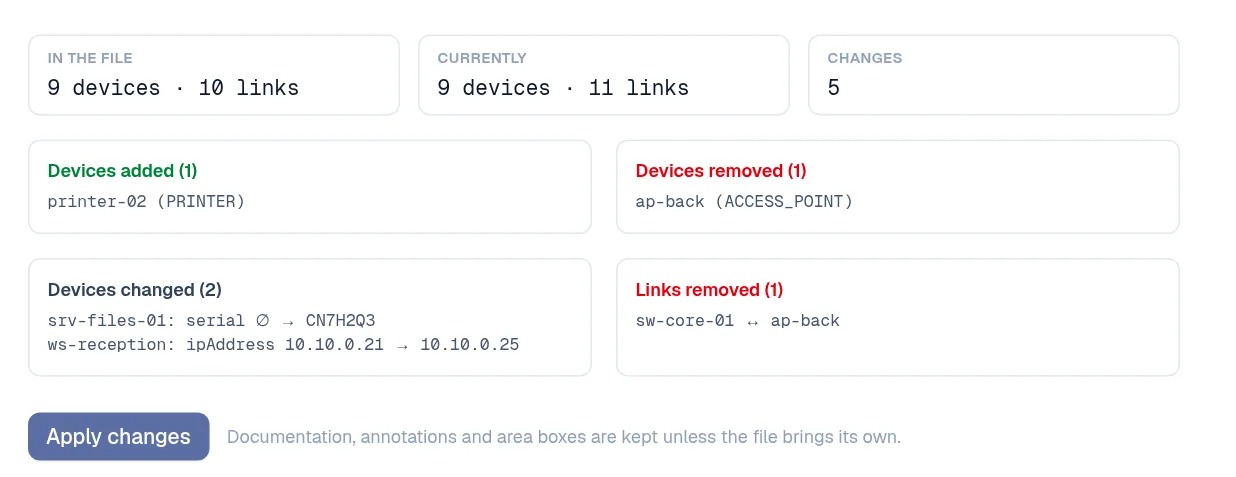 Refresh: what NetBox added, removed and changed, before anything is applied
What ApexDiagram adds on top
NetBox records what exists. A diagram is where you add what NetBox does not model well:
- Data flows. Which application talks to which, on what protocol and port. Firewall rules can then be generated from the flows.
- Planned changes. Mark devices as planned, draw the new switch, and show the change before it happens.
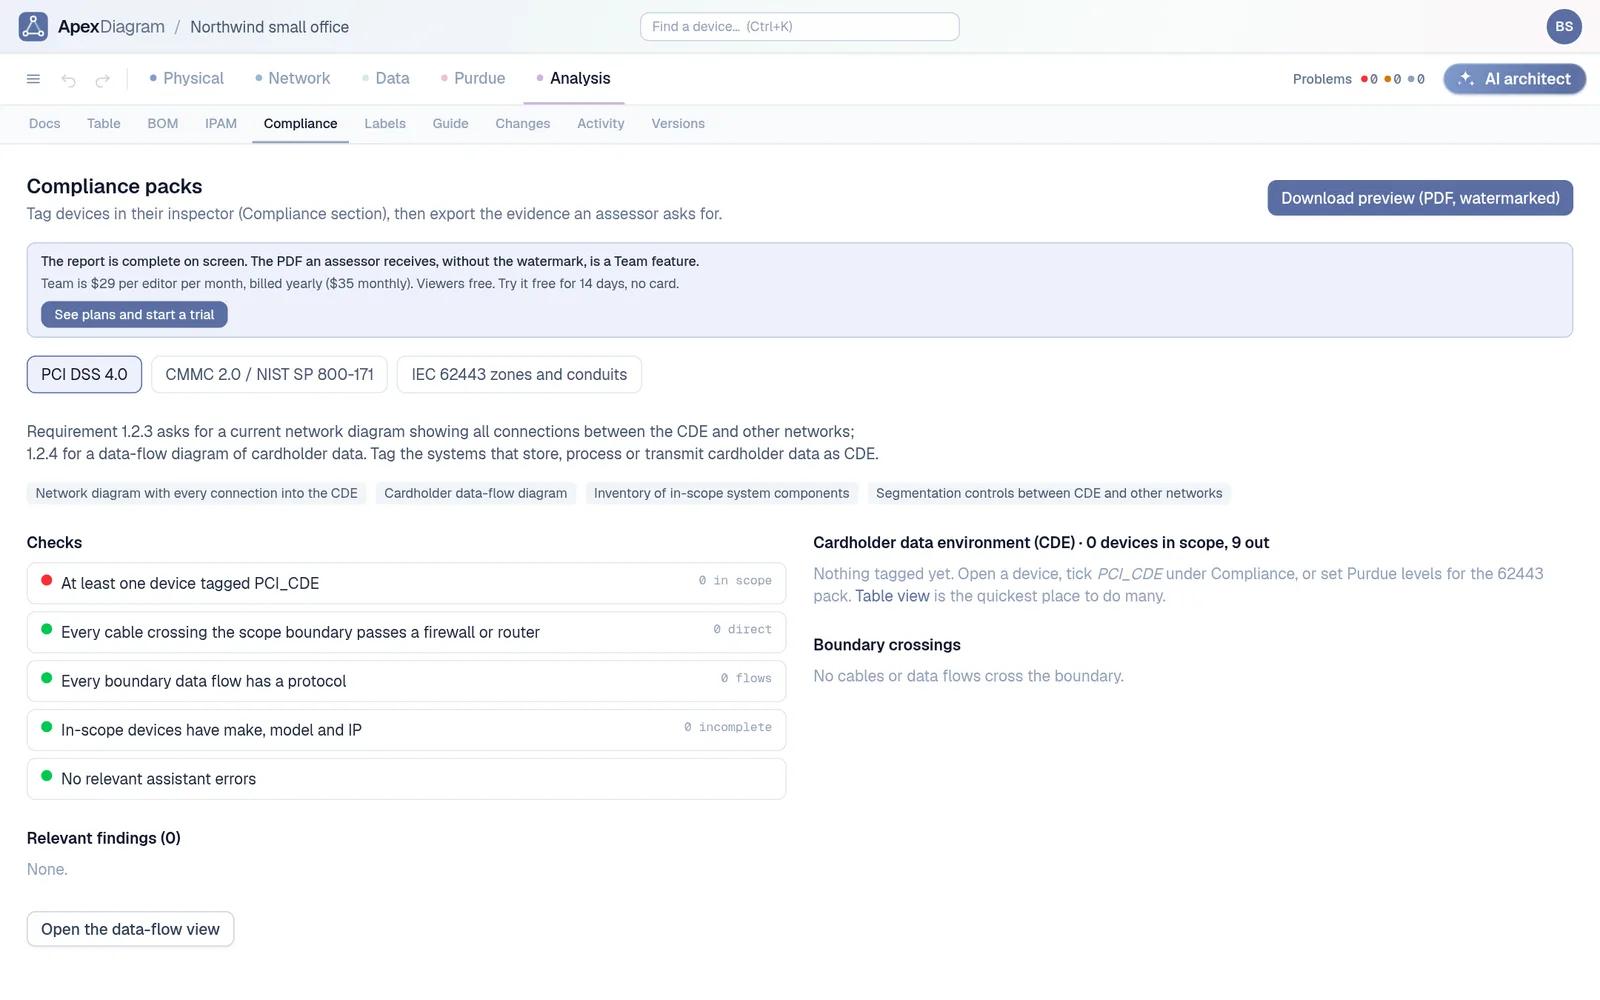
- Compliance scope. Tag the PCI cardholder data environment or CUI systems and get the boundary report.
- Checks. The diagram assistant looks at the result as a network, not as rows: duplicate addresses, a cable longer than its type allows, a rack unit used twice, a static address inside a DHCP pool.
Keep NetBox as the master
The rule that keeps this sane: change NetBox, then refresh the diagram. Do not edit the same device in both places. If the diagram finds a mistake (two devices in one rack unit, a duplicate IP), fix it in NetBox and pull again.
You can also go the other way for the bits NetBox does not hold: the REST API and YAML export let a script read the flows or the BOM back out.
Plans differ on the live pull and the API. See plans and pricing.
Document your network once, keep it current
One network graph, four synchronized views, a linter and a bill of materials. Import the Visio or draw.io file you already have.
Join the beta