Nine devices, two ways: Visio, then ApexDiagram
· 5 min read
The same small-office network documented step by step in Visio, about two hours, and in ApexDiagram, about fifteen minutes.
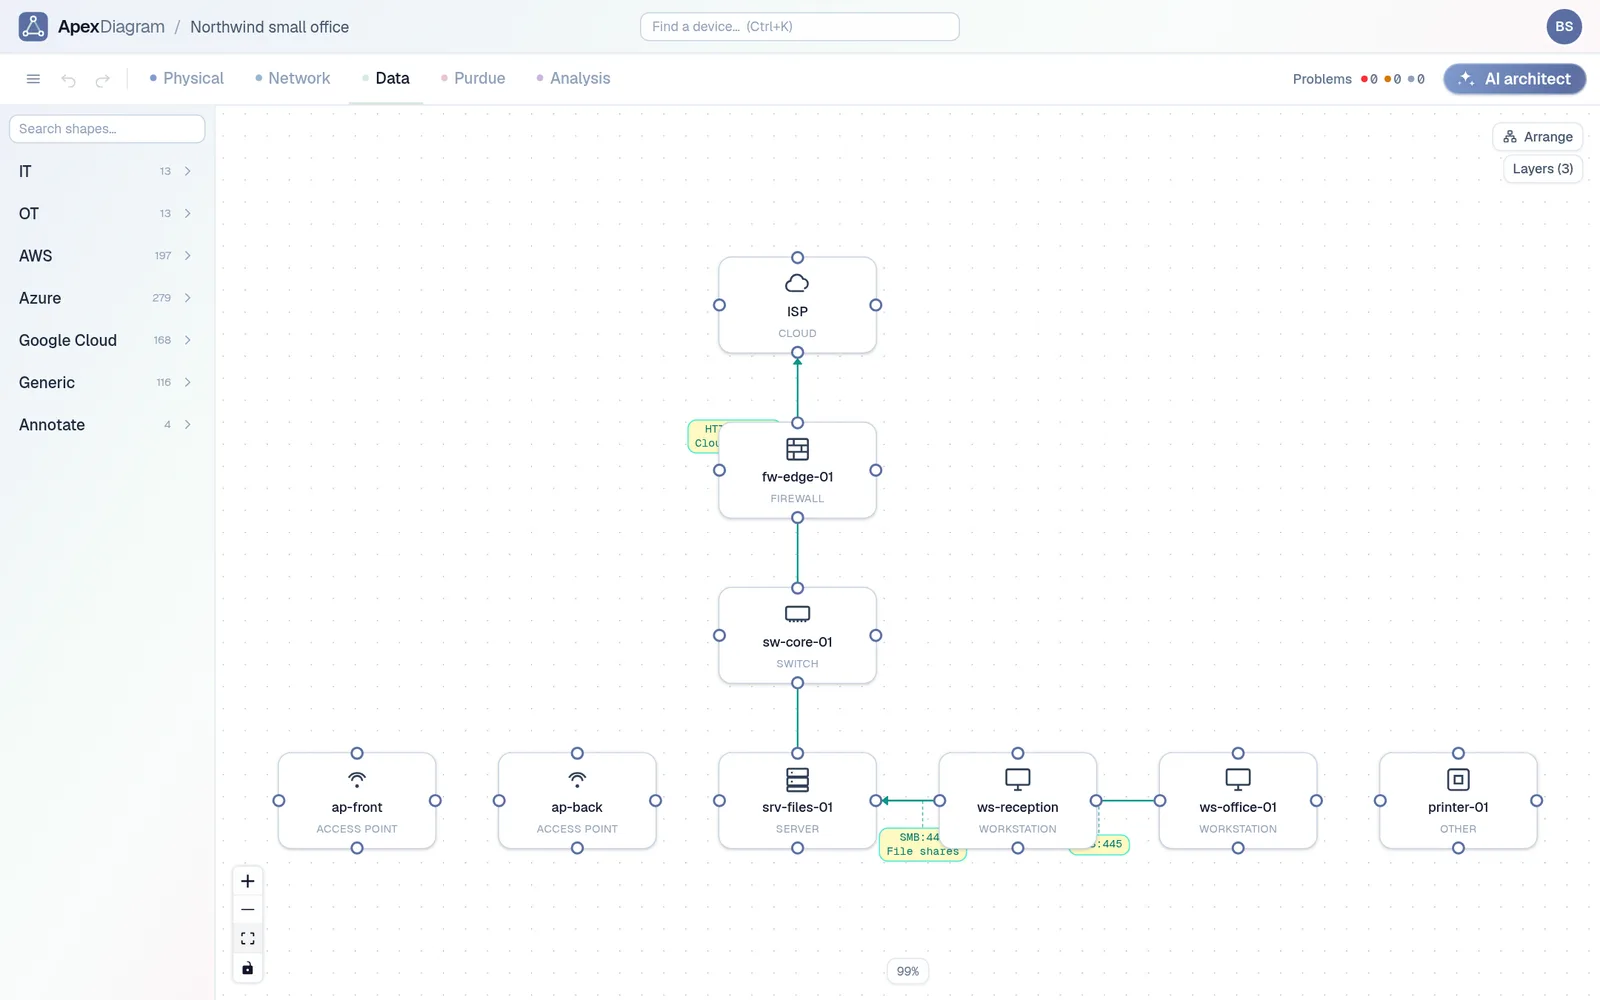
The network is a small office you have seen a hundred times: an internet connection, a firewall, a core switch, a file server, two wireless access points, two workstations and a printer. Three VLANs: Staff, Guest Wi-Fi and Management. One 12U wall rack in a comms cupboard. Nine devices in all.
The brief is the one every IT lead gets: a topology diagram for the wiki, a physical layout for the cabling contractor, an IP list, and a parts list for the second office we are opening next year. Here is how long each takes.
The hard way: Visio
1. Find the stencils. File, New, search for "Basic Network Diagram". Open the Shapes pane, More Shapes, Network, and pin Network and Peripherals, Computers and Monitors, and Servers. Scroll to find a firewall that looks like a firewall. About ten minutes, more the first time.
2. Place and label nine shapes. Drag each one onto the page. Double-click to type a name. Decide, shape by shape, whether the label goes under or beside the icon. Fifteen minutes.
3. Draw the cables. Pick the Connector tool. Drag from the internet to the firewall, from the firewall to the core switch, then from the core switch to each of the six hosts. Eight connectors. Choose a line style for the Cat6a server run so it differs from the Cat6 runs. Right-click each connector to set the routing style so lines stop crossing. Twenty minutes, and the lines still cross.
4. Add the IP addresses. You have two choices. Type them as text next to each shape, which looks fine and means nothing. Or open Shape Data on every shape, add an IP Address field, and fill it in nine times, which you can later export to Excel with Data, Link Data to Shapes, if you have Plan 2 and an afternoon. Most people type text. Ten minutes.
5. Show the VLANs. Draw three rounded rectangles behind the shapes, colour them, label them Staff, Guest Wi-Fi and Management, and send them to back. Move each device into its box, then re-route the connectors you just fixed. Ten minutes.
6. The physical layout. Insert a new page. Open the Rack Diagram template, drag a 12U rack, then drag rack-mounted versions of the firewall, switch and server, which are different shapes from the ones on page one. Type the same names again. Draw the room outline and put the access points and workstations in it. Thirty minutes, and page two now knows nothing about page one.
7. The IP list and the parts list. Open Excel. Type nine rows: name, type, make, model, IP, VLAN, rack unit. Type the same names a third time. Add a second sheet for the order: quantities by model, cable counts and lengths, which you estimate from the drawing. Twenty minutes.
8. Check it. Look at the drawing carefully. Is any IP used twice? Does a cable run exceed 100 metres on Cat6? Is the server in a rack unit the switch already occupies? Visio cannot tell you. You trust your eyes.
Running total: about two hours. Three files that describe the same nine devices. Then the firewall is replaced in March, and the three files disagree until someone finds the time.
The easy way: ApexDiagram
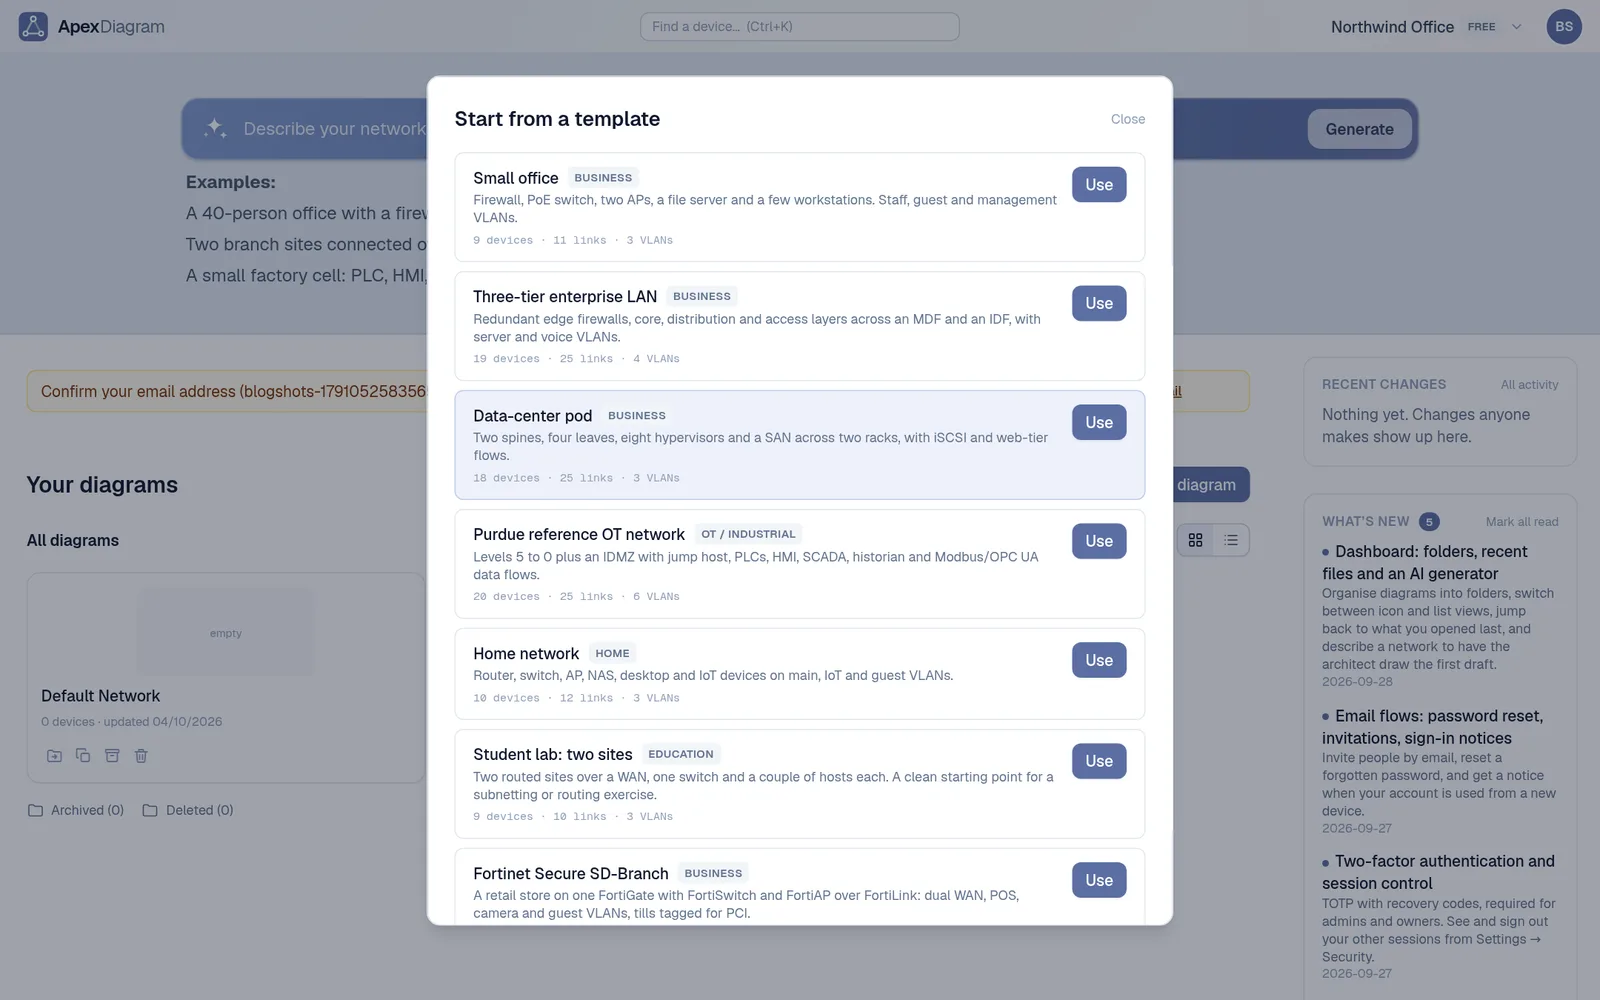
1. Start from the template. Dashboard, Start with a template, Small office. Nine devices, three VLANs, the cables and a wall rack appear in all four views. Or drop in the Visio file from above and import it. Under a minute.
Start from a reference network: the built-in templates
2. Correct what differs from your office. Rename the switches, set the models in the device popup, change the IPs on the ports. Every edit is one field in one place. Five minutes.
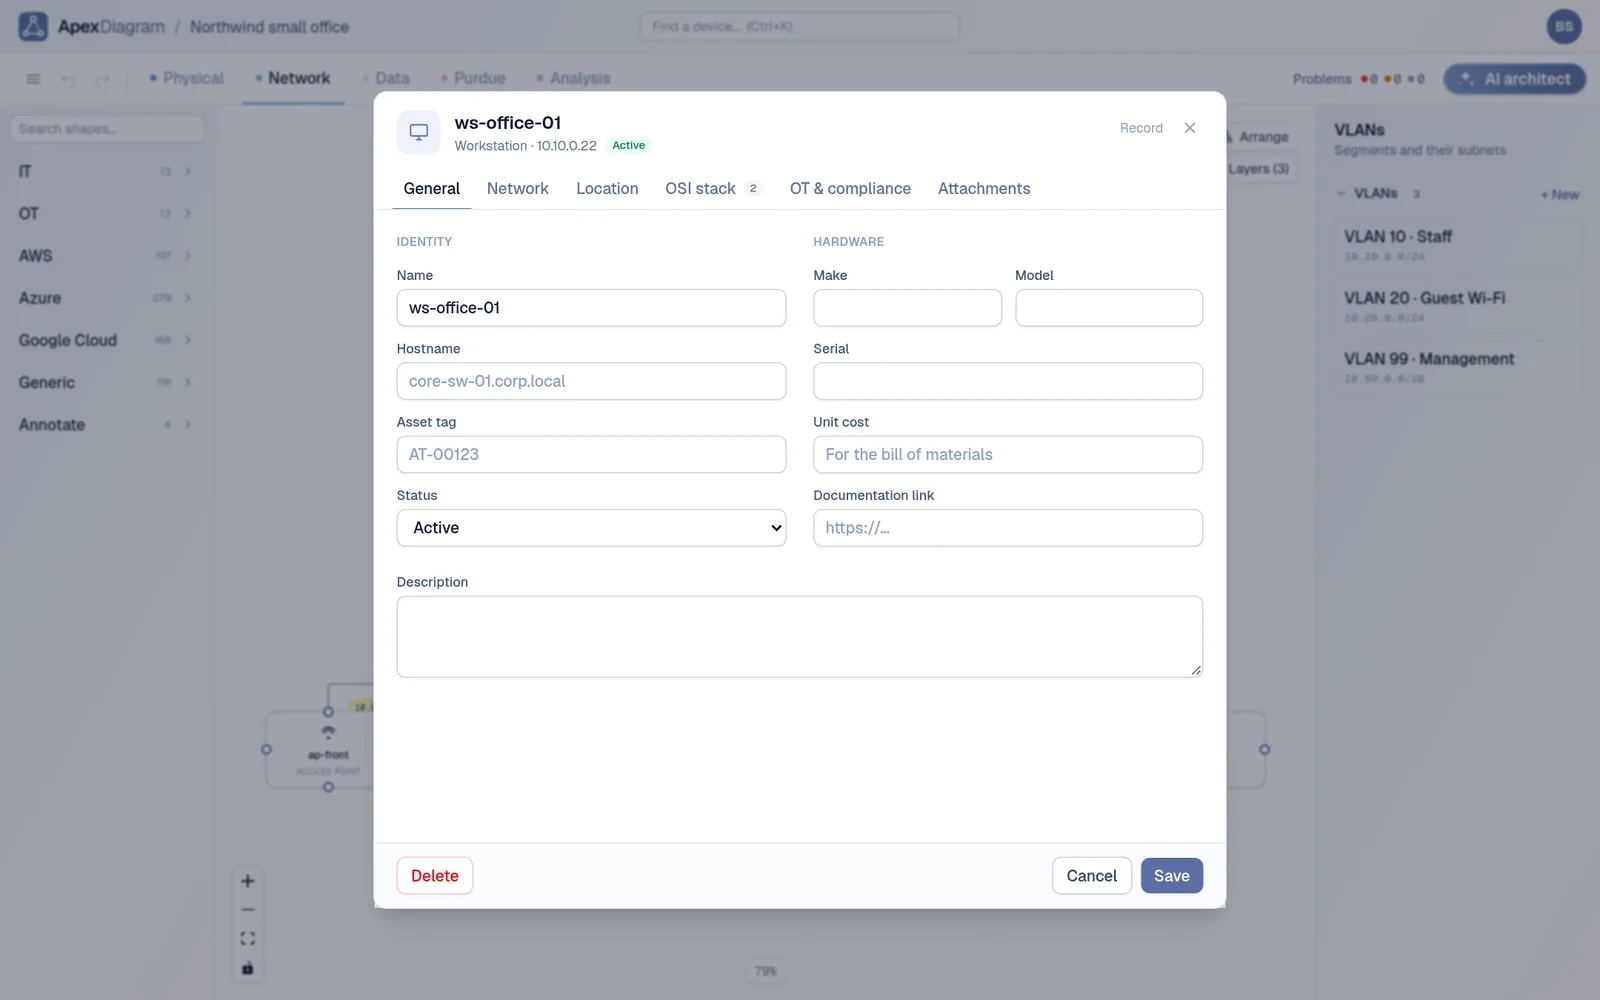 Every device opens in one popup: general details, network, location, OSI stack, OT and compliance, attachments
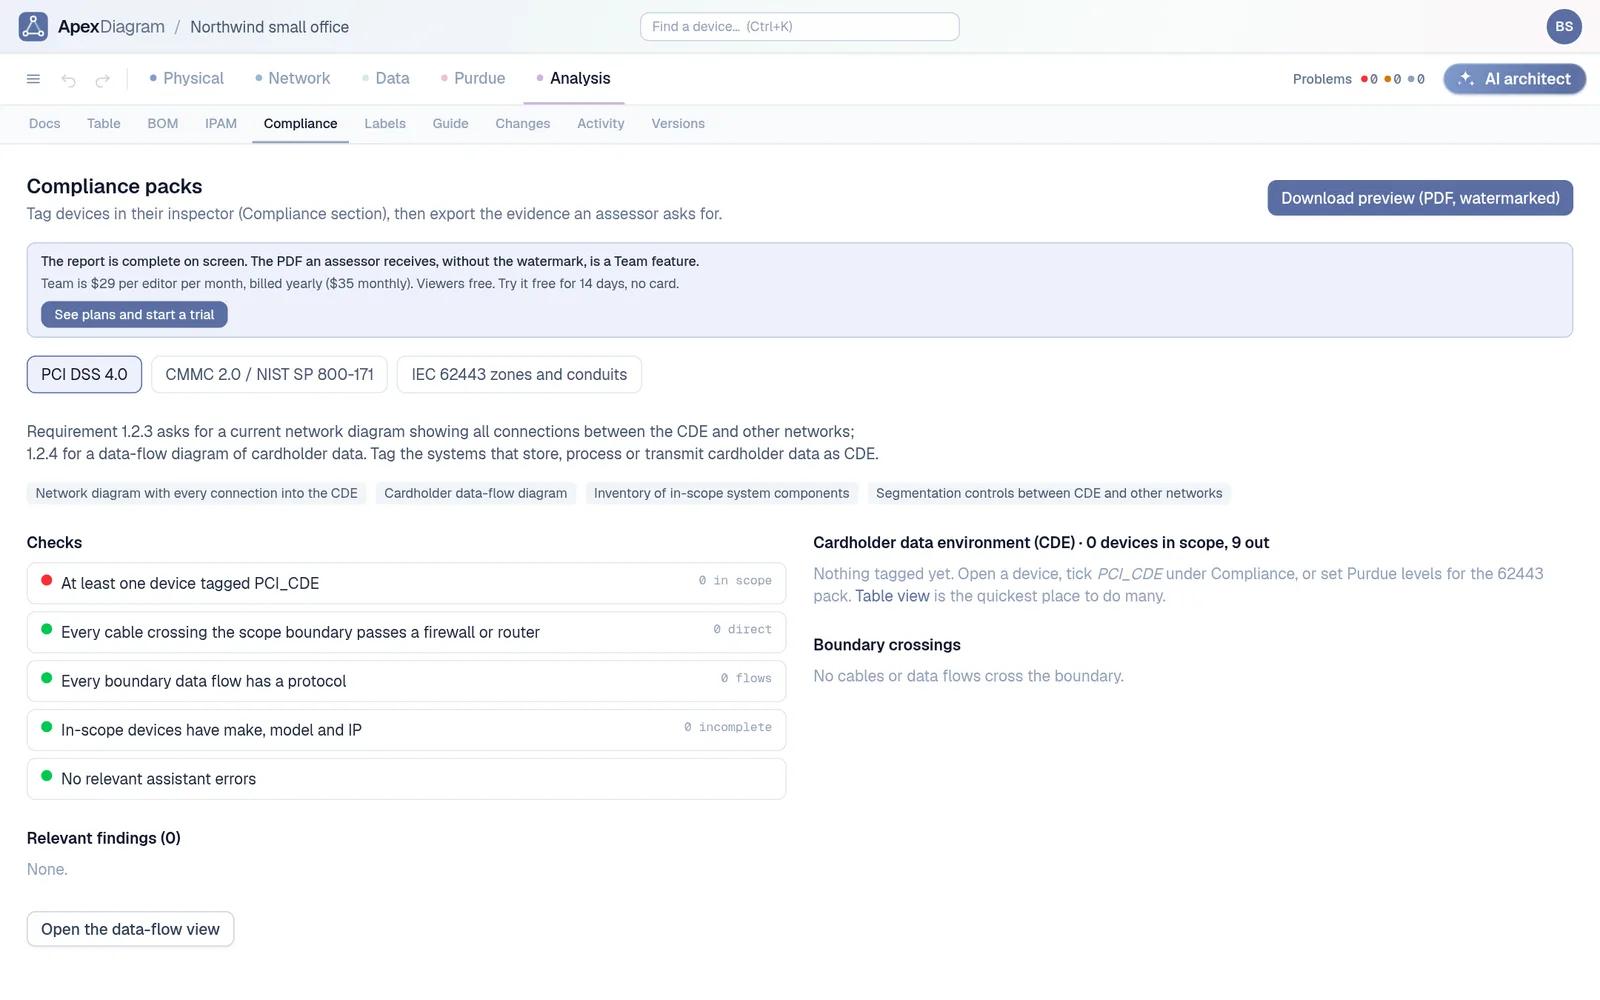
3. Look at the views. Network covers OSI layers 2 and 3: who is cabled to whom, every address and VLAN on the links, and the VLAN list with each subnet beside it. Move a device to another VLAN and its subnet follows. Physical shows the site, the comms cupboard and the rack, with the cables coloured by type. Data, for protocols and ports, and Purdue are there if the auditor ever asks. Press Arrange in any view that looks untidy. Two minutes.
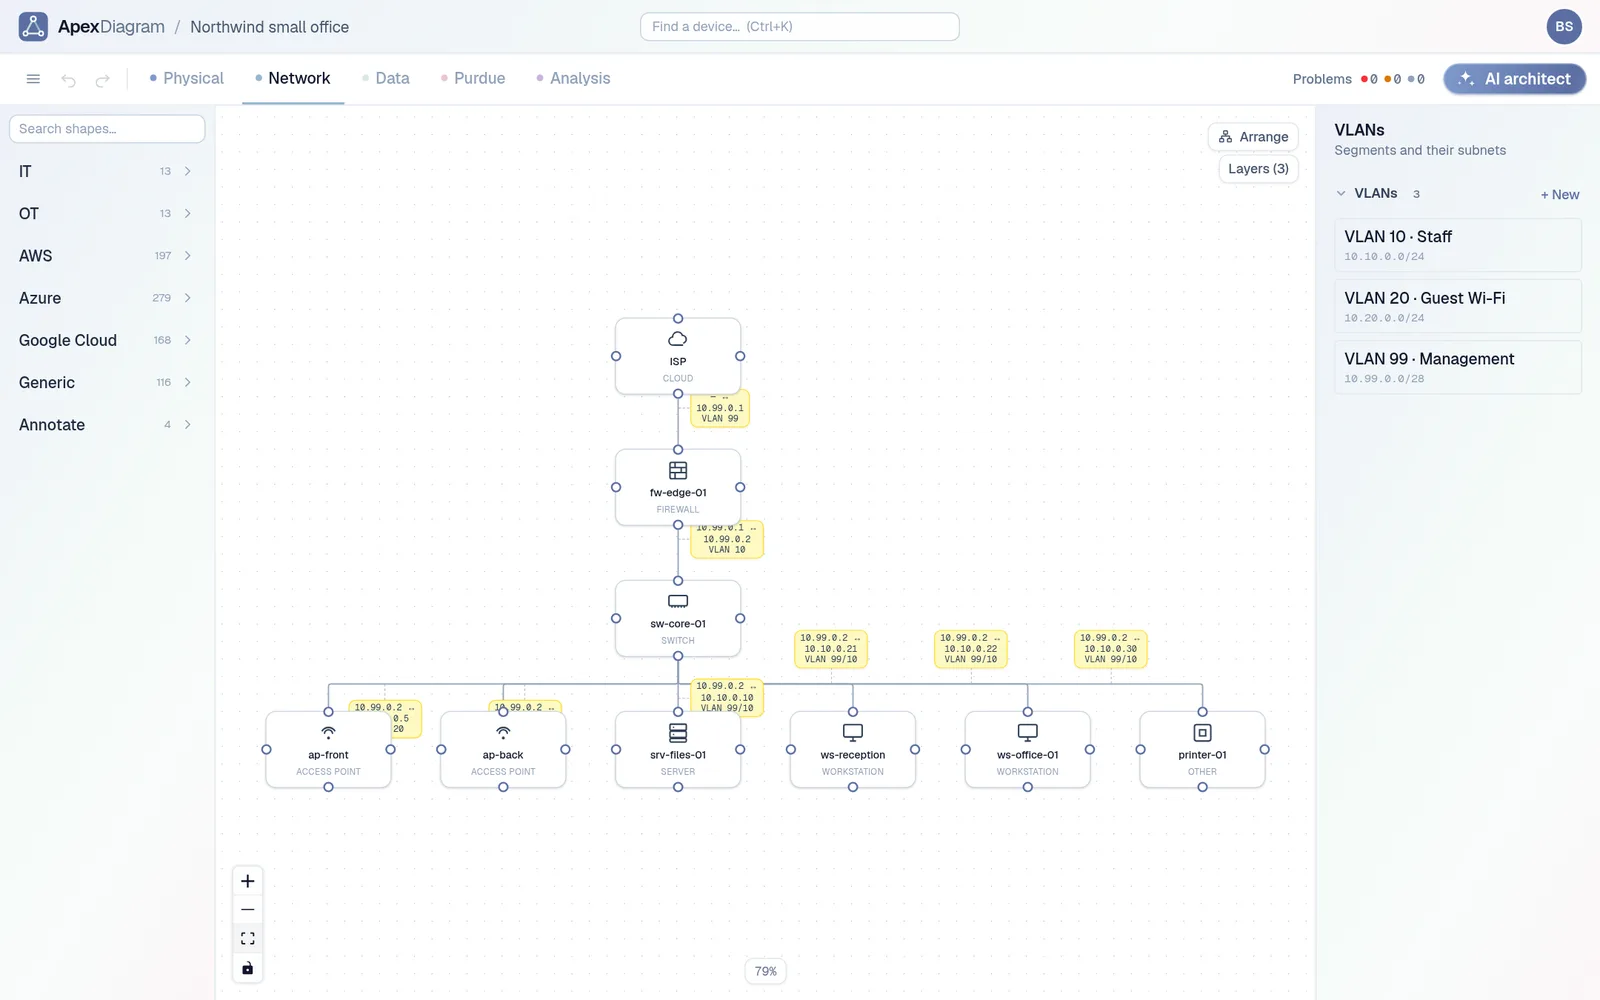 The Network view: addresses and VLANs on every link, subnets in the VLAN list
4. Let the linter check it. Open the Problems panel. Give the second workstation the first one's address by mistake and it reports the duplicate IP straight away. The same panel catches addresses outside their subnet, Cat6 runs over 100 metres and two devices in the same rack unit. Click a finding and the view opens on the device. Fix it and the finding disappears. Three minutes.
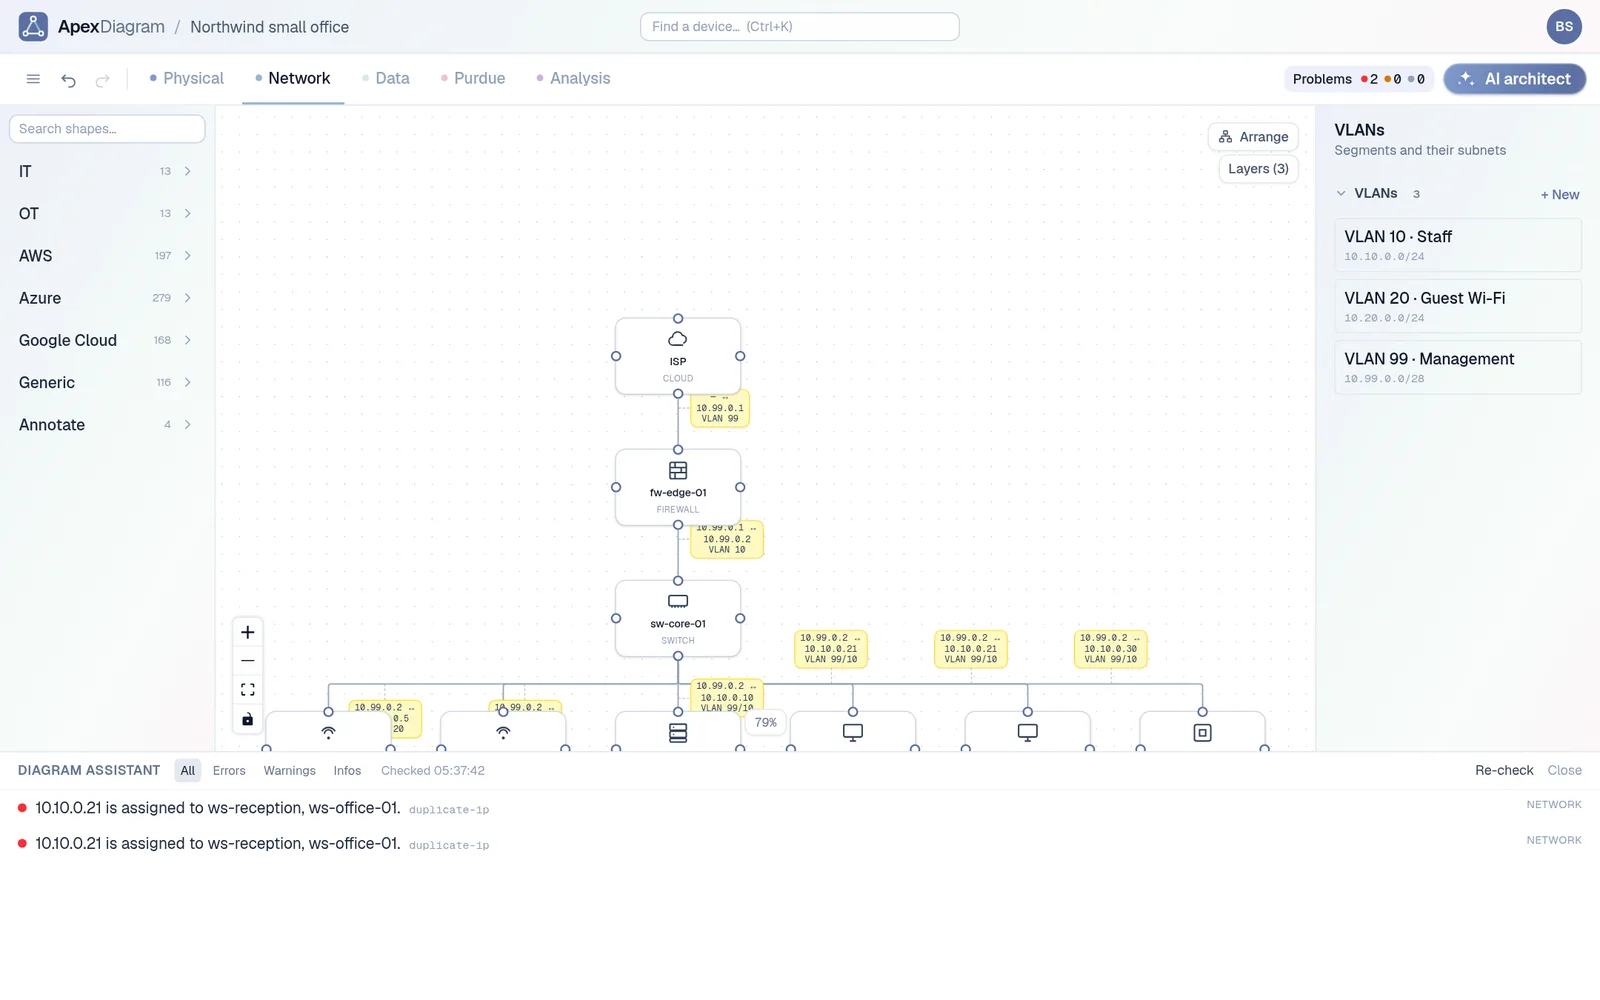 The diagram assistant catching a duplicate IP
5. The IP list. Open the IPAM tab. Every subnet with its usable range, the addresses in use, utilisation and the next free address. Nothing to type; it is read from the ports. Zero minutes.
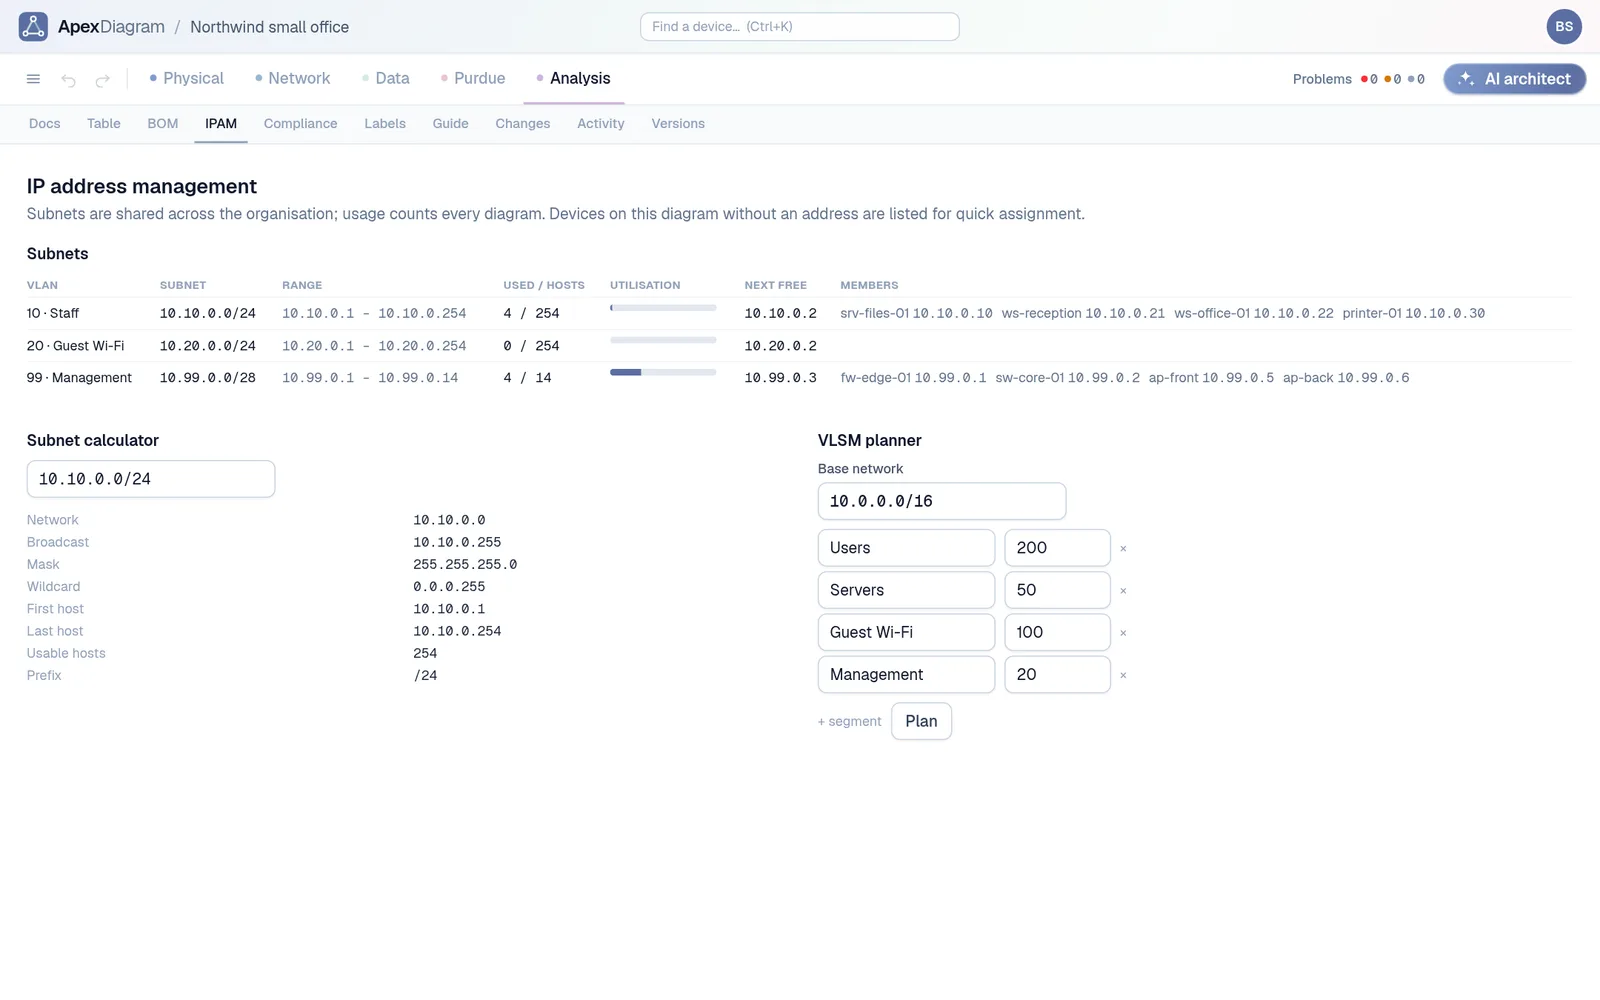 The IPAM tab: utilisation and the next free address per subnet
6. The parts list. Open the BOM tab. Devices grouped by make and model with quantities, cables grouped by type with lengths summed. Add unit costs in the device popup if you want a priced quote. Export as CSV, Excel or PDF. One minute.
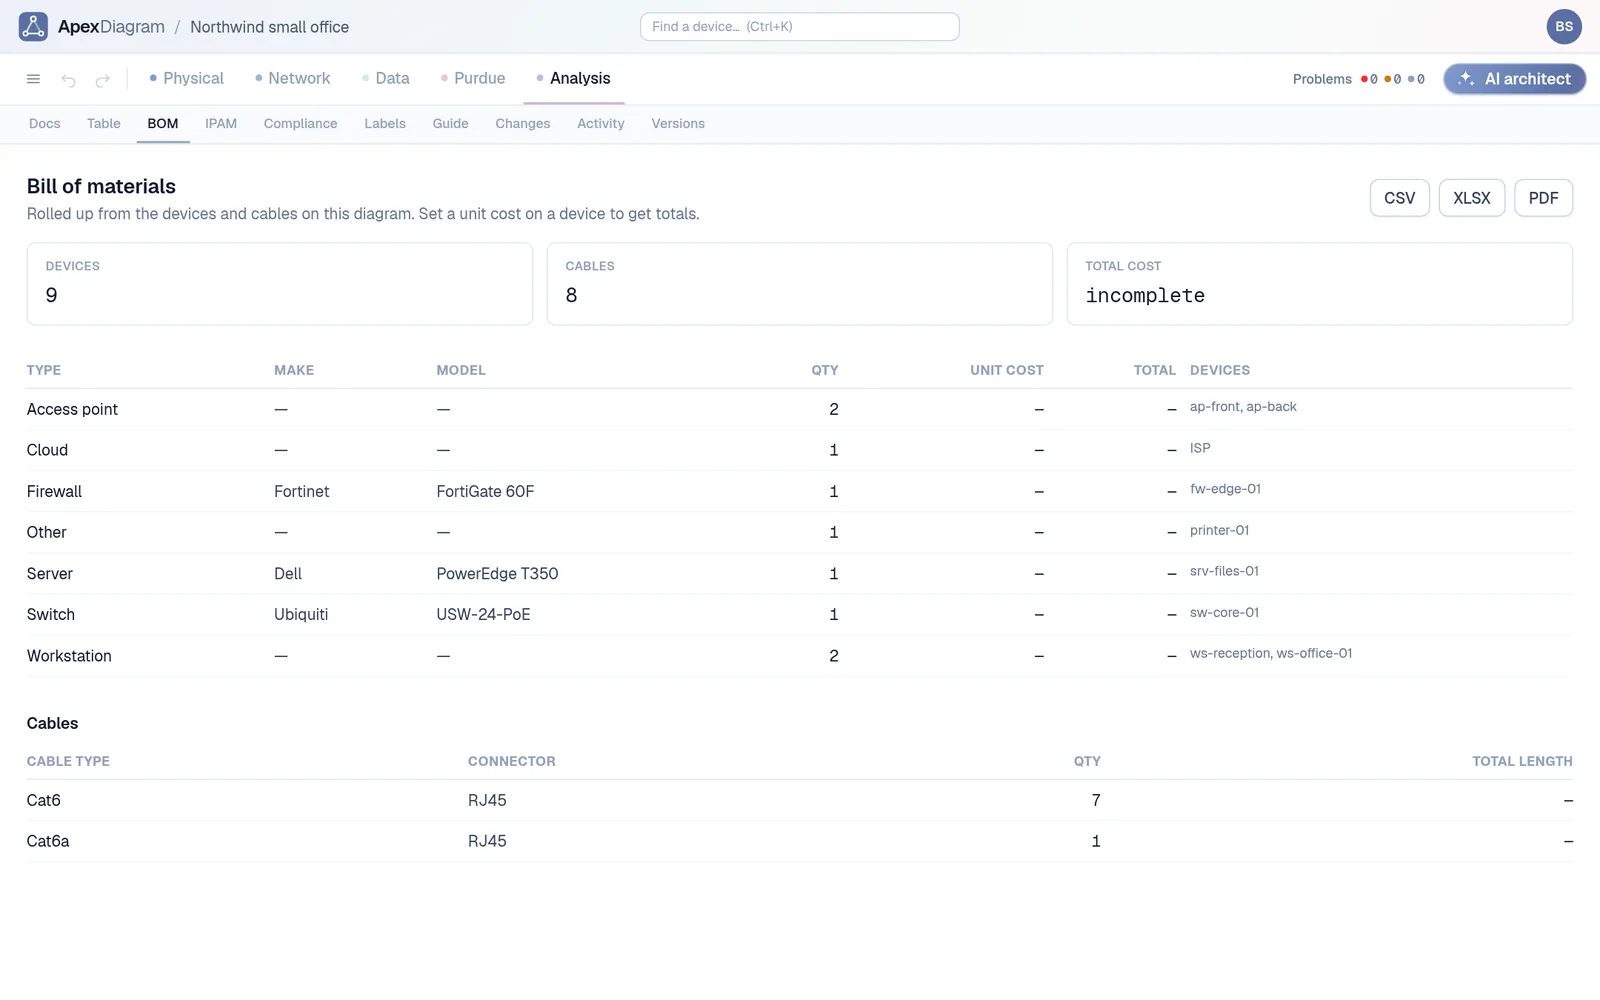 The bill of materials, rolled up from the diagram
7. Export and share. Export any view as PNG, SVG or PDF for the wiki. Create a read-only share link for the cabling contractor that expires in thirty days. Print the device labels with QR codes. Two minutes.
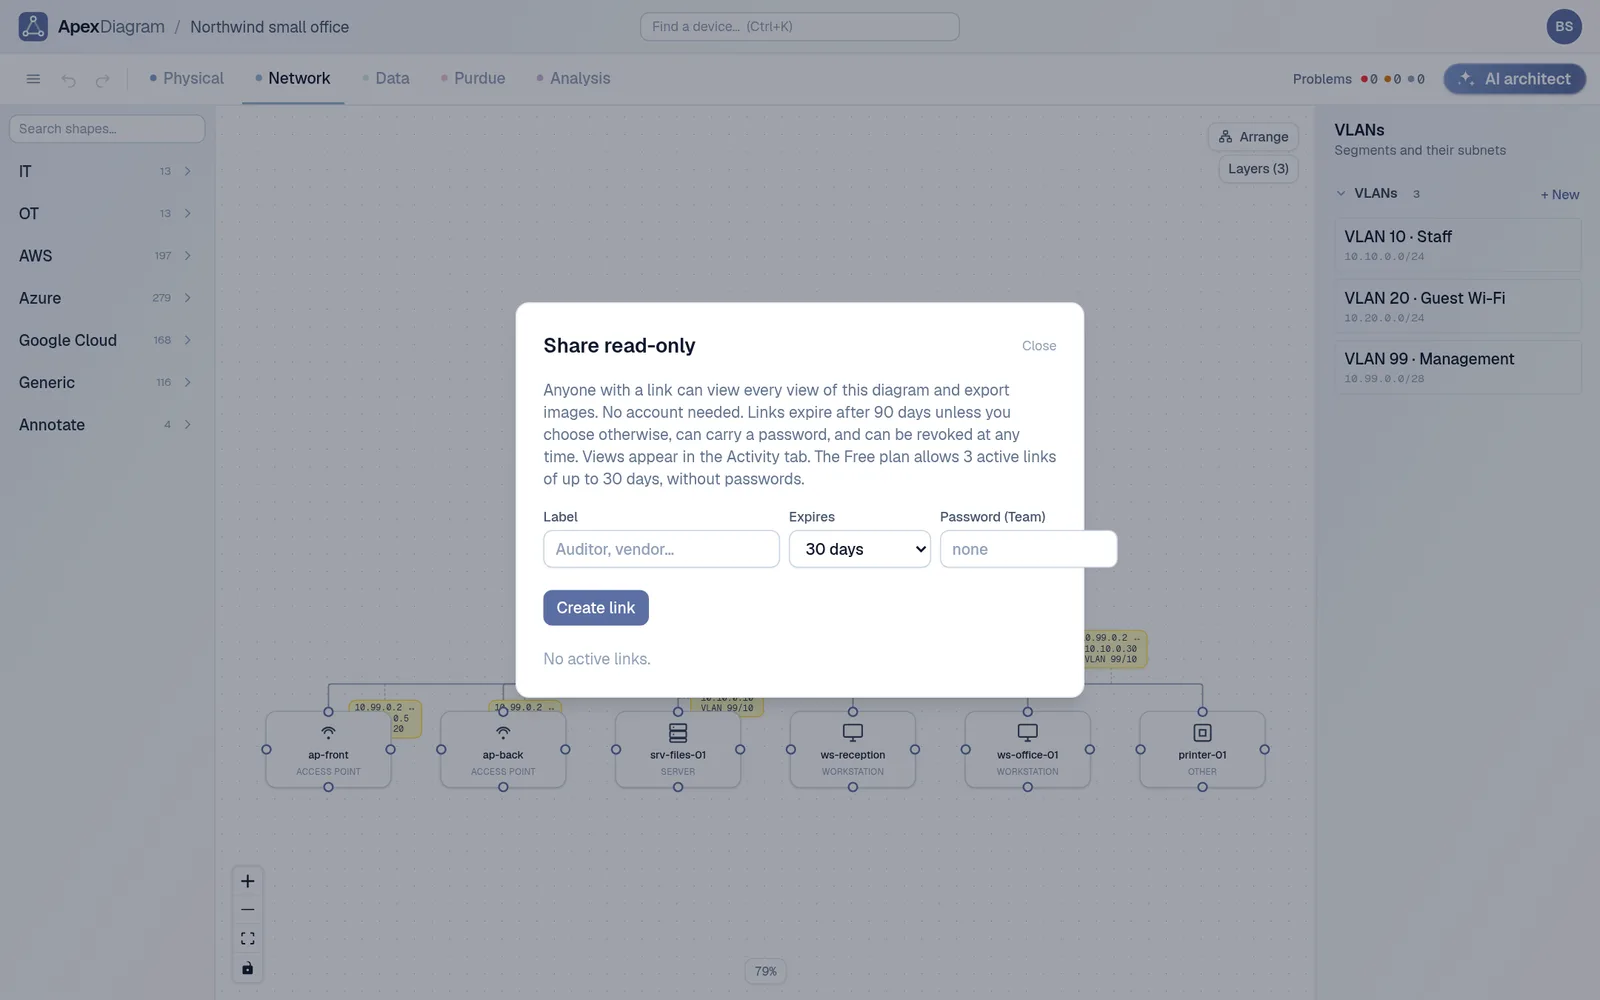 A read-only share link for the cabling contractor
Running total: about fifteen minutes. One record. When the firewall is replaced in March, change the model and serial on one device, and the topology, the rack, the IP list and the BOM are all current. If a colleague changes it, the Versions tab shows the diff and lets you restore.
What the comparison does not say
Visio is a fine drawing tool and you can draw things in it that ApexDiagram will never draw. The point is narrower: a network diagram is a description of a network, and a tool that understands the description can check it, count it, label it and keep it current. A tool that only understands rectangles cannot.
Import the Visio file you already have. See plans and pricing.
Document your network once, keep it current
One network graph, four synchronized views, a linter and a bill of materials. Import the Visio or draw.io file you already have.
Join the beta